After resounding requests from our InTheKnow users, we have added maps to our Business Intelligence platform. With this new feature in place, we can see why it was of major importance to our users. The maps easily lend order to our complex data sets. Not only are they aesthetically pleasing but allow users to easily identify trends visually as opposed to sorting through a long list of data. Along with being able to now visualize data sets here are five examples of how the BI map feature can be used to save you time and research and find new business opportunities.
Developers
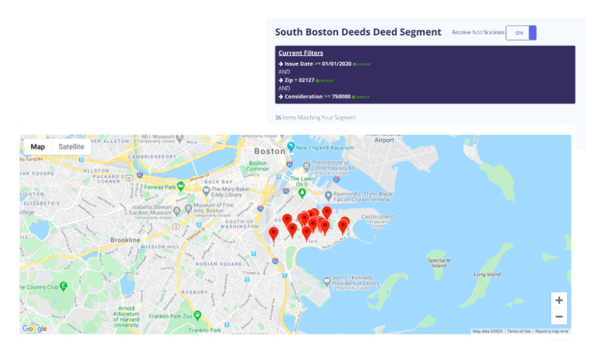
Considering purchasing a parcel of land (or a building) in busy South Boston. While deals may be hard to come by in this area you want to ensure what you are paying is in line with the market. Using our map feature you can see recent transactions around the parcel you are interested in and then rank those transactions in order of cost to see the near real-time value of the land or building you are interested in.
Vendors
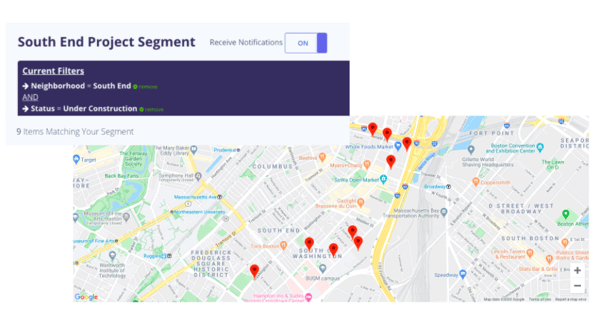
Those of you with products to sell into active construction sites often spend hours driving around looking to make connections on projects. The next time you have a meeting in the South End (when construction starts up again) you can quickly look at BLDUP’s map tool to see what other active projects are in the area. Along with viewing the map, you can also easily see who the GC, developer, and architect are on each project so you have all the data crucial to making the sale.
Brokers
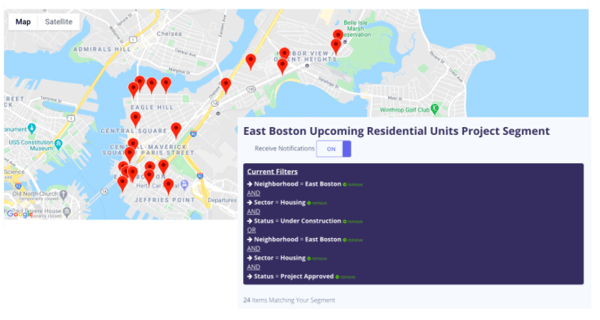
Meeting with a developer building a luxury condo project in East Boston. Want an easier way to prep your market report? Pull a map showing not only what is under construction now but other projects in the pipeline.
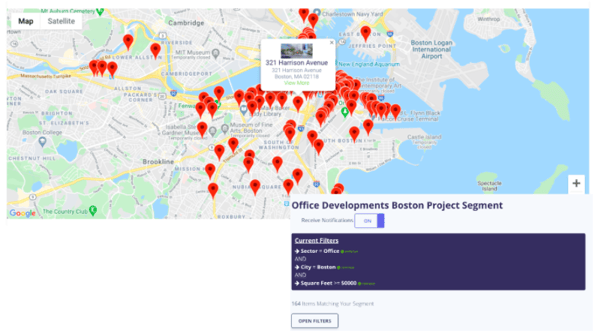
Investors
Prior to the COVID-19 outbreak, Boston had one of the strongest markets in the country with investors from across the globe looking for opportunities in our region. If you are not local and looking for an easy way to visualize the development and sales pipeline in the region, our maps make that easy. You can sort by building type and square footage to see where the deals that are of interest to you are happening.
Anyone who is tired of looking at multiple municipal websites
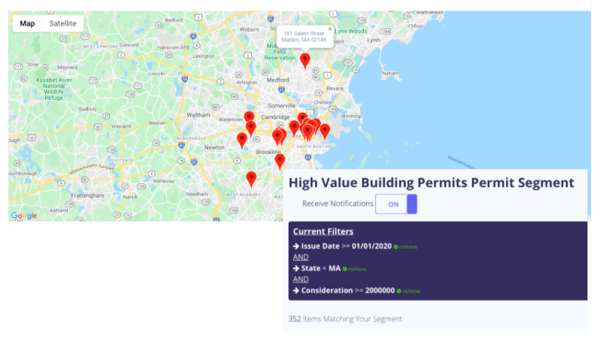
Sick of sorting through countless data sources to look for building permits? Run a segment and easily see where any high-value building permits have been issued. The dollar volume and location are customizable so you can easily see where building permits of interest to your company are being pulled.